Supabase can hold application data, authentication and access policies in one project. Skene's analytics destination adds another owned surface: skene.track() events stored as Iceberg and Parquet tables in an Analytics Bucket in your Supabase Storage.
This walkthrough separates three connections that are easy to confuse. A read-only Supabase connection gives Skene schema definitions. An analytics destination receives events your application sends through skene.track(). PostHog and Mixpanel remain optional analytics sources that Skene can query for recent event counts. One does not silently copy data from another.
The analytics destination
Your application sends events to Skene's POST /api/v1/track endpoint with a secret key carrying the analytics:write scope. Accepted events enter a workspace buffer. Skene processes them in batches, maintains recent samples and daily rollups, and writes the long-term destination into the Analytics Bucket you configured.
The destination is separate from the Supabase OAuth connection and can point to a different project. You choose the bucket and provide its server-side credentials in Settings → Supabase. Skene stores those credentials encrypted and does not expose them again after saving.
The resulting default.events table belongs to your Supabase project. The setup screen includes a DuckDB query so you can verify that events are landing in the bucket.
A client call stays small:
skene.track("team_invite_completed", {
  team_id: team.id,
  inviter_id: user.id,
  invitee_count: invites.length,
})
If your team already uses PostHog or Mixpanel, keep those calls and dashboards. Skene does not replace them or copy their raw events into your bucket. You can add skene.track() where you want an owned event record, or connect PostHog or Mixpanel as a source for recent counts on the lifecycle map.
The lifecycle map joins code and schema evidence
Skene analyzes the linked repository for tracking calls and reads the linked Supabase schema for tables, columns, types and relationships. Read-only mode does not read row values. From those sources, Skene builds a lifecycle journey and an Events inventory.
A step can have code evidence, database evidence or both. The Events page shows where each item was found, what lifecycle step it supports and whether the step still has a gap. The lifecycle canvas shows the same evidence in context.
A full analysis rebuilds the journey. A Status check rescans code, rereads the schema and rematches evidence against the existing journey. Workspace files under skene-context/, including journey.yaml, preserve the result and can also be supplied from a repository or the CLI.
Flows shows observed paths
The journey describes what should happen. Flows shows paths that users actually took. Its browser script records clicks, page navigations, form submits and rage clicks with a write-only publishable key, then draws page nodes and weighted transitions.
A page detail view shows total events, distinct sessions, average time, click targets and exit points. Interaction events stay in Skene's Postgres-backed Flows store for 90 days. They do not use the Analytics Bucket path described above.
That distinction matters. Flows is interaction capture for observed navigation. The analytics destination is long-term storage for named skene.track() events. They are separate pipelines with separate keys and retention behavior.
Review tracking on every pull request
The Skene GitHub App reviews pull-request diffs when PR reviews are enabled. It can flag a removed or renamed tracking call and attach a suggested edit when the fix fits a single contiguous block. Findings that need a broader change include a prompt for a coding agent.
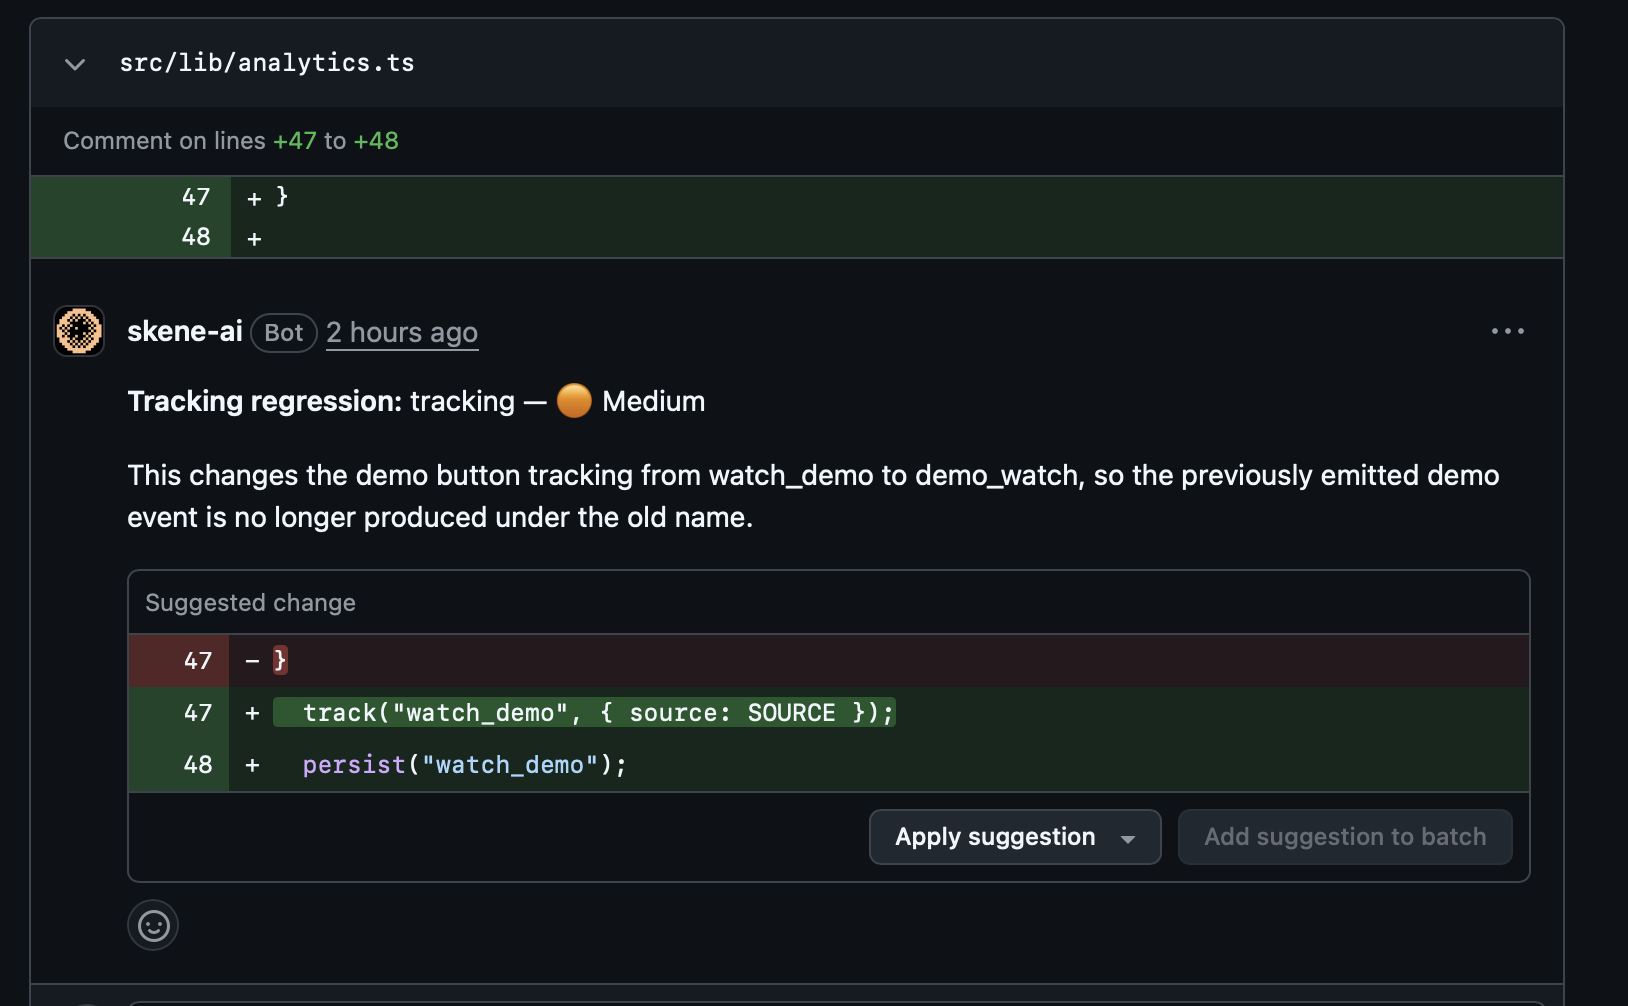
A pull-request review names the changed event and the file that contains it.
For tracking removed by the pull request, /skene fix can restore the deleted call in a follow-up pull request. It cannot add an event that never existed. Missing-event findings use the prompt block instead.
The deterministic check available through Skene's API and MCP tools serves a different purpose. It compares scanned events and database coverage with the planned baseline. Running it inside a coding agent lets the agent inspect the working tree before anything is pushed.
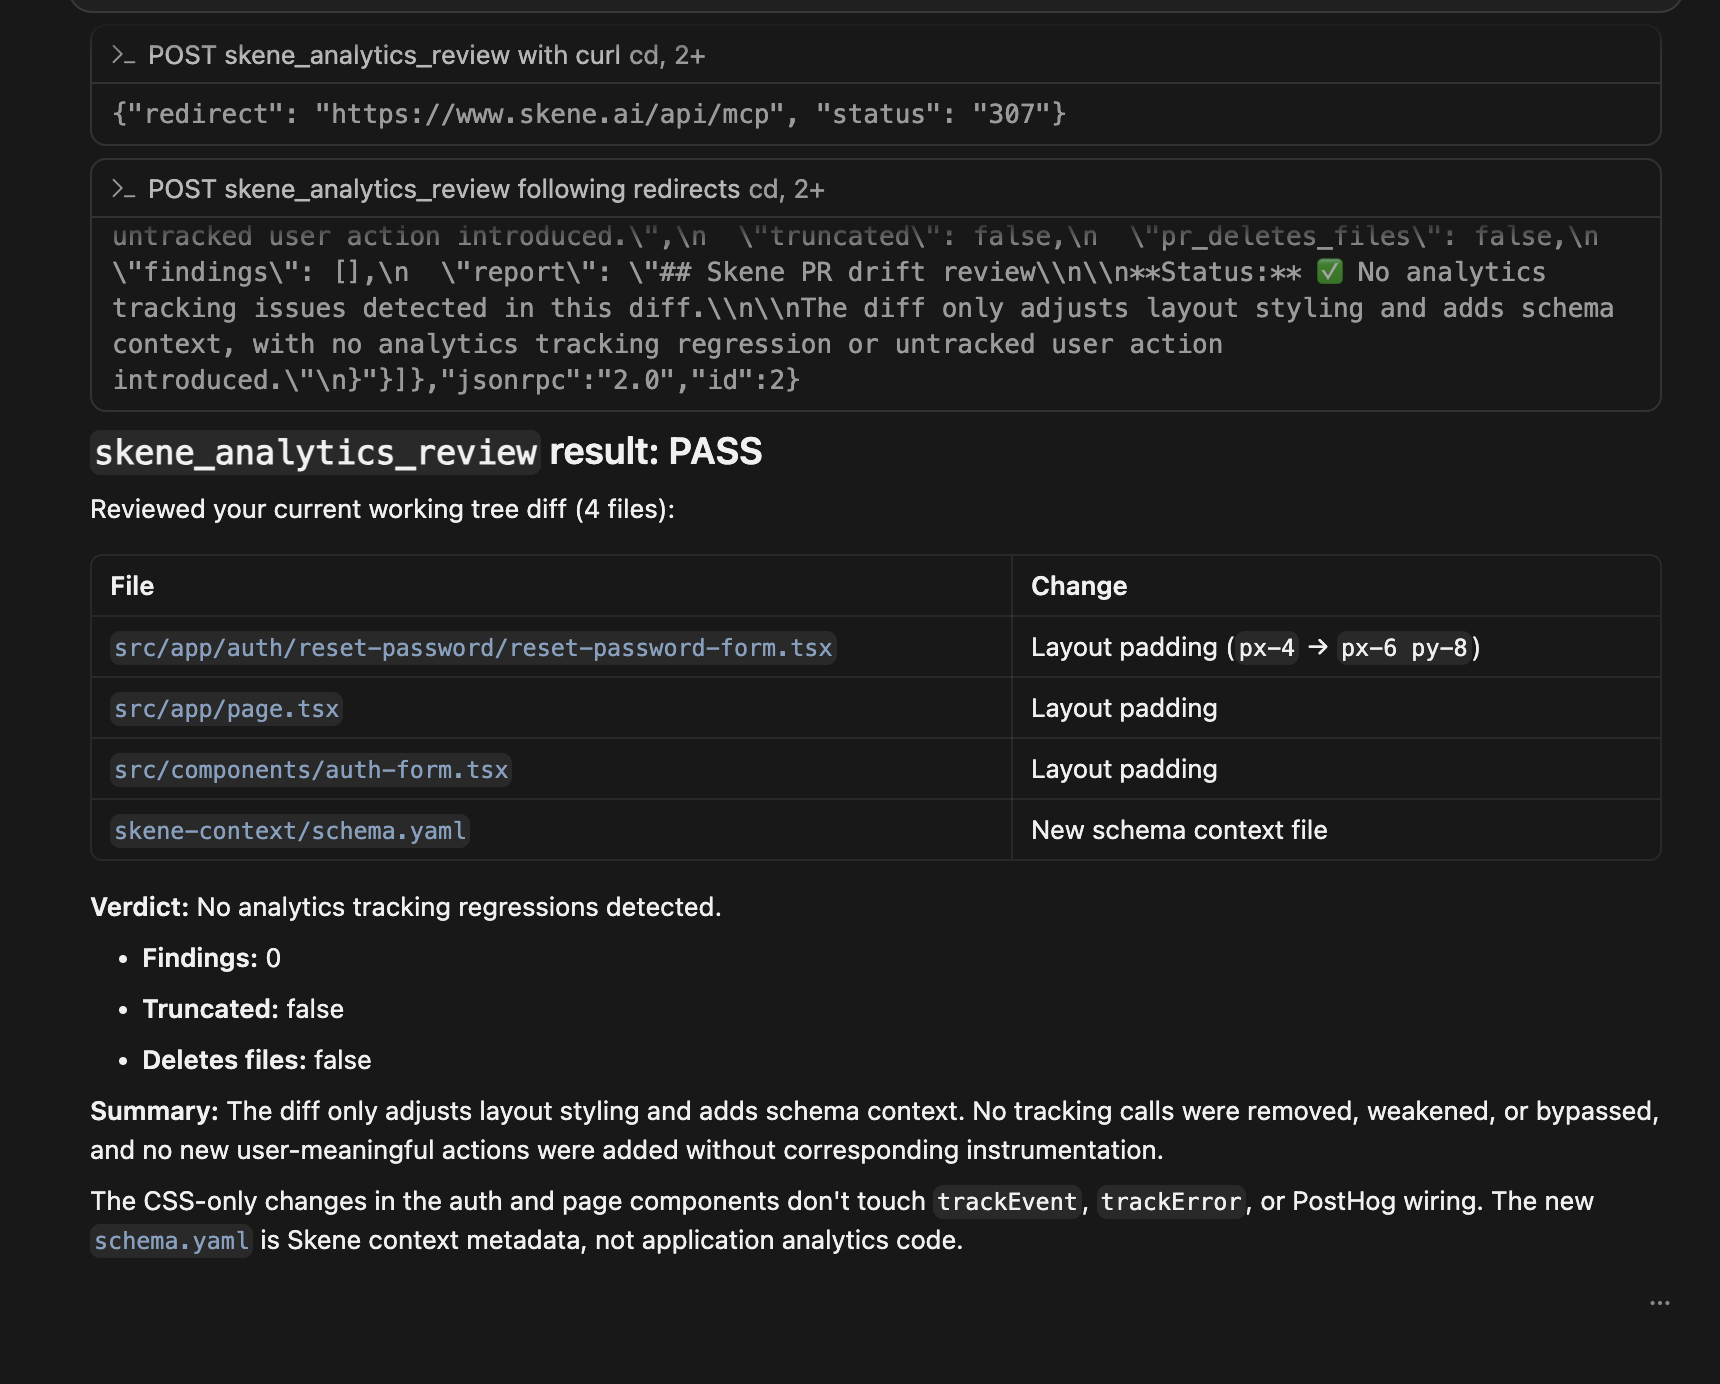
An MCP review can check the working-tree change before it reaches GitHub.
Keep each system in its job
PostHog and Mixpanel can remain the product-analytics surfaces your team already uses. A read-only Supabase connection grounds the journey in database structure. The analytics destination gives selected events an owned long-term home. Flows captures observed navigation. Pull-request and deterministic checks protect the evidence that feeds the plan.
None of those surfaces makes missing history retroactive. Their value is catching the gap before the period you need to measure has passed.
Try it
Connect your repository and run the first analysis. Add a read-only Supabase connection for schema evidence, then configure an analytics destination if you want skene.track() events written to your own Analytics Bucket. Read the docs or open the Skene OSS repository for the local analysis workflow.
Continue with Skene
How Skene works
Skene reads the event writes in your code and checks them against your Supabase schema on every PR.
Skene vs. analytics tools
Compare keeping your telemetry in your own Supabase to shipping events to hosted product analytics platforms.
Pricing
Skene OSS is free and the free audit costs nothing. Pro is $249 a month; Enterprise is quoted.